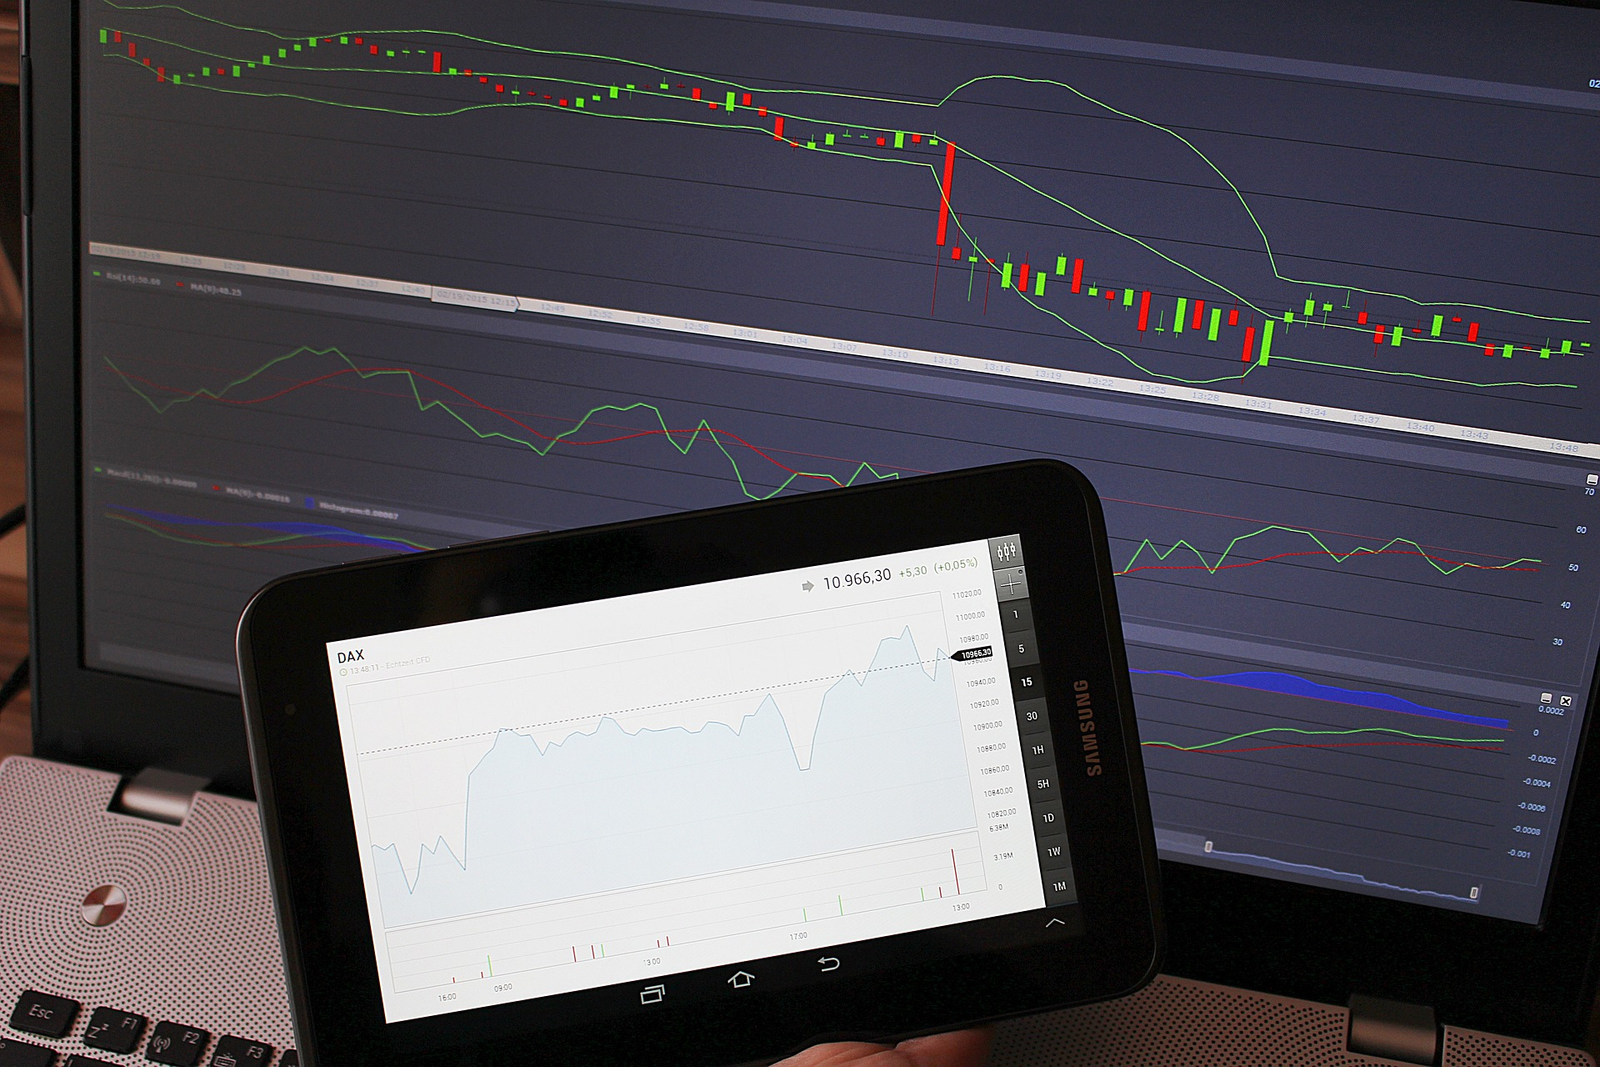
Stock market mein paisa invest karne ka soch rahe ho? Agar haan, toh technical analysis ek aisi strategy hai jo aapko stock market ko behtar samajhne mein madad karegi. Aaj ke time mein, investors aur traders technical analysis ka istemal karte hain taaki wo market ke movement ko predict kar sakein. Yeh article aapko basic concepts se lekar advanced techniques tak sab kuch batayega taaki aap technical analysis ko samajh sako aur use apne trading mein apply kar sako.
Table of Contents
## Technical Analysis Kya Hai?
Technical analysis ek aisi approach hai jisme stock price aur volume data ka analysis kiya jata hai taaki future price movements ko samjha ja sake. Iska main focus yeh hota hai ki market ka mood ya trend ko dekhte hue past price movement ke basis par future trends ko identify kiya jaye. Isme charts aur graphs ka istemal hota hai jo stock ki historical data ko visually dikhate hain.
## Kaise Kaam Karta Hai Technical Analysis?
Technical analysis ka “price reflects everything” basic assumption yeh hota hai. Matlab stock price jo hai, usme saari information already reflected hoti hai. Yeh price demand aur supply ke base par move karti hai, aur technical analysts is pattern ko study karte hain taaki future movements ko predict kar sakein.

## Technical Analysis ke Key Concepts
1.Price Action:
Technical analysis ka main base hai price action. Yeh wo movement hai jo kisi bhi stock ka price time ke saath karta hai. Price charts ko dekh kar analyst samajh sakte hain ki stock ka trend kis direction mein hai.
2.Trend:
Market trend ka matlab hai ki stock prices ek specific direction mein move kar rahe hain. Market mein 3 types ke trends hote hain:
- Uptrend: Jab stock prices lagatar badh rahe hote hain.
- Downtrend: Jab stock prices gir rahe hote hain.
- Sideways Trend: Jab prices ek specific range mein move karte hain, na badhte hain na ghirte hain.
3.Support aur Resistance Levels:
Support level wo price point hota hai jahan stock ki demand itni zyada hoti hai ki price aur neeche nahi girta. Resistance level wo point hota hai jahan supply zyada hoti hai aur price us point se upar nahi jaa pata. Yeh levels kaafi useful hote hain entry aur exit points decide karne mein.
4.Volume:
Volume batata hai ki kitne shares kisi specific time period mein trade hue hain. High volume ka matlab hota hai ki particular price movement significant hai, jabki low volume ka matlab ho sakta hai ki movement weak hai.
## Common Technical Indicators
Technical analysis mein kai tarah ke indicators use kiye jaate hain jo traders ko better decisions lene mein help karte hain. Yeh indicators price aur volume data ke basis par bante hain. Yahan kuch common technical indicators hain jo aksar use hote hain:
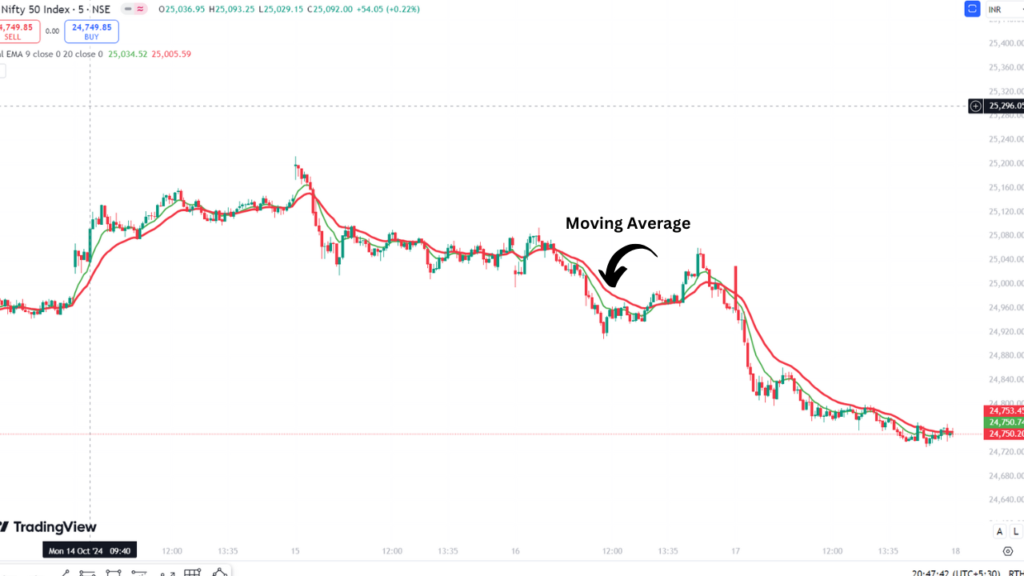
1.Moving Average (MA):
Yeh ek lagging indicator hai jo past price data ka average calculate karta hai. Iska purpose yeh hota hai ki price ka smooth trend dikhe aur chhoti-chhoti fluctuations ignore ki ja sakein.
Simple Moving Average (SMA)aur Exponential Moving Average (EMA) do common types hain.

Moving Average Indicator: Ek Powerful Tool for Traders
2.Relative Strength Index (RSI):
Yeh ek momentum oscillator hai jo batata hai ki koi stock overbought ya oversold position mein hai. RSI ka value 0 se 100 ke beech hota hai. 70 se upar ka value overbought signal deta hai, aur 30 se neeche ka oversold.
RSI Indicator Kya Hai? Ek Best Guide
3.Bollinger Bands:
Yeh indicator price ka volatility measure karta hai. Bollinger Bands ke andar 3 lines hoti hain – ek middle line jo moving average ko represent karta hai, aur upar aur neeche do bands jo standard deviation se calculated hote hain. Jab price bands ke bahar move karta hai, toh yeh signal deta hai ki stock overbought ya oversold hai.
4.MACD (Moving Average Convergence Divergence):
Yeh ek dual moving average system hai jo stock ki momentum ko measure karta hai. MACD line aur signal line ka cross signal deta hai ki buying ya selling ka opportunity hai.
5.Fibonacci Retracement:
Yeh ek tool hai jo historical price movements ke beech ratios ko calculate karta hai taaki future support aur resistance levels ko predict kiya ja sake.
## Technical Analysis mein Charts ka Role
Charts technical analysis ka sabse powerful tool hain. Yeh visually dikhate hain ki price aur volume data time ke saath kaise change ho raha hai. Commonly used charts mein include hain:
- Line Chart: Sabse simple chart jo closing prices ko ek line mein plot karta hai.
- Bar Chart: Yeh chart opening, high, low, aur closing prices ko ek bar ke form mein dikhata hai.
- Candlestick Chart: Yeh chart sabse zyada popular hai kyunki isme zyada information hoti hai jaise open, high, low, aur close price ek candle ke form mein. Candlestick patterns se trend reversals aur continuation ko predict kiya ja sakta hai.
## Candlestick Patterns
Short-term trading decisions lene ke liye Candlestick patterns kaafi useful hote hain . Yahan kuch common patterns hain jo traders aksar follow karte hain:
- Doji: Yeh pattern tab banta hai jab stock ka open aur close price same hota hai, aur yeh signal deta hai ki market mein indecision hai.
- Hammer: Hammer pattern ek bullish reversal signal hota hai jo tab banta hai jab stock ka price neeche gir kar wapas recover hota hai.
- Shooting Star: Yeh ek bearish reversal signal hota hai jab price high par jaakar wapas neeche close hota hai.

## Technical Analysis ke Fayde aur Limitations
Fayde:
- Entry aur Exit Timing: Technical analysis aapko sahi time par entry aur exit lene mein madad karta hai.
- Market Trends Ko Samajhna: Isse aap market ke trends aur momentum ko samajh kar behtar trading decisions le sakte hain.
- Risk Management: Stop-loss aur support-resistance ka use karke aap apne risk ko control kar sakte hain.
Limitations:
- Lagging Indicators: Kaafi indicators lagging hote hain jo market ke baad signal dete hain, is wajah se late entry ya exit ho sakti hai.
- False Signals: Kabhi-kabhi technical indicators false signals dete hain jo aapko galat trading decisions lene par majboor karte hain.
- Fundamentals Ko Ignore Karna: Technical analysis sirf price aur volume par based hota hai aur company ke fundamentals ko ignore karta hai.
## Technical Analysis vs Fundamental Analysis
Jab baat analysis ki aati hai, toh do main approaches hoti hain technical analysis aur fundamental analysis. Dono ka approach alag hai.
Technical Analysis price aur volume ko study karta hai, jabki Fundamental Analysis company ke financial health, management, market position, aur other economic factors ko dekhta hai.
Long-term investors fundamental analysis ko zyada preference dete hain, jabki short-term traders technical analysis par zyada focus karte hain.
## Kaise Start Karein Technical Analysis?
Agar aap beginner ho, toh pehle basic concepts samajhna important hai. Iske baad aapko charts aur indicators ko use karna seekhna chahiye. Kaafi online platforms jaise TradingView ya Zerodha aapko free tools dete hain taaki aap practice kar sakein. Initial stages mein, paper trading ya demo accounts ka use karna best rahega taaki aap bina paise khoye seekh sakein.
### Conclusion
Technical analysis ek aisi technique hai jo aapko stock market ko deep level par samajhne ka mauka deti hai. Yeh ek art aur science dono hai, jisme practice aur patience zaroori hai. Jab aap technical analysis seekh lete ho aur ise apne trading mein effectively use karte ho, toh aap apne trading decisions mein zyada confident aur disciplined ban sakte ho.
Hamesha yaad rakho, ki koi bhi strategy foolproof nahi hoti. Risk management ka importance samajhna aur apni strategy ko time ke saath improve karna trading mein success ki key hai. Happy trading!
—
Is article ke madhyam se aapko technical analysis ki ek comprehensive understanding mili hogi. Trading ko seriously le aur apne analysis ko upgrade karte rahein!


